See what your machine is doing, right now
TRACE gives maintenance technicians, automation engineers, and controls engineers a direct, real-time and historical view of PLC signal behavior. Set up takes under 2 minutes, no long configuration, so you can check a signal while it's still happening.
Try it for 30 days
Full access to every module, no card required. Reach out and I'll set you up.
Request a 30-day trialRead the docs
TRACE itself is closed-source, but the docs, screenshots and roadmap are public on GitHub.
View TRACE docs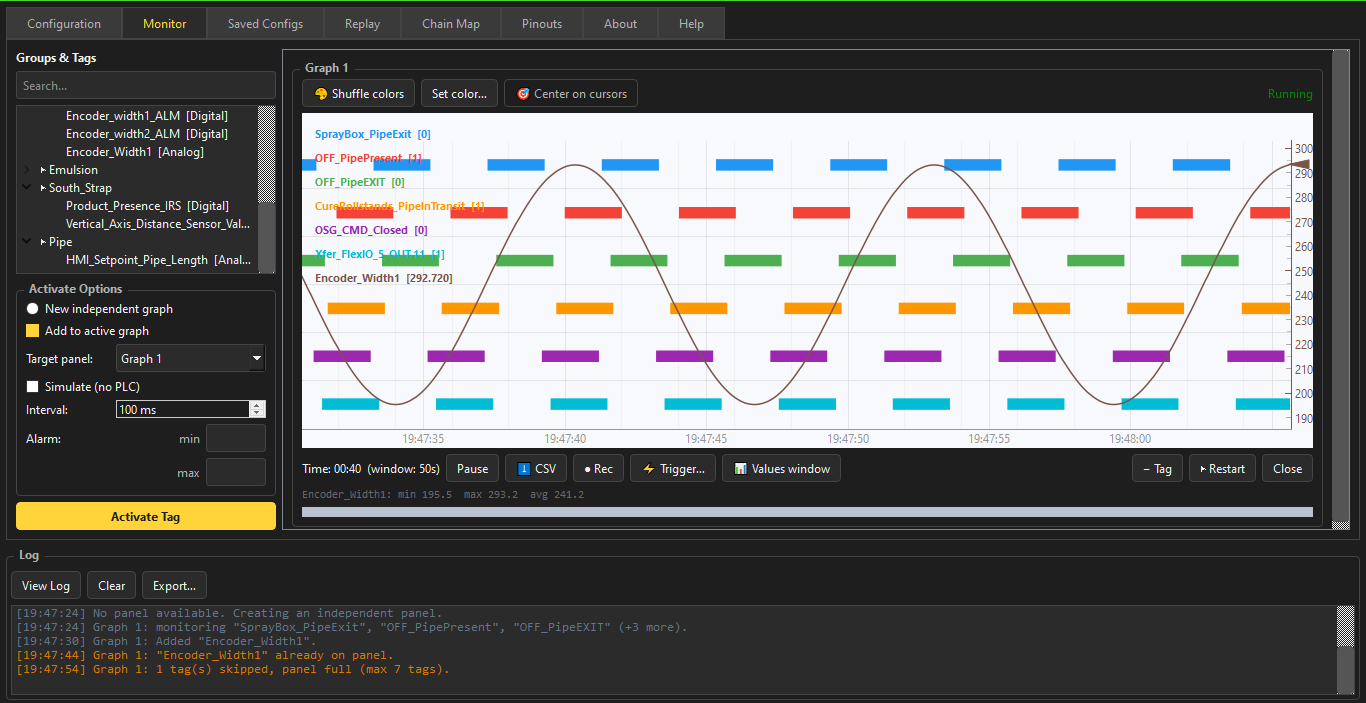
Four modules, one application
Live Monitoring
Multiple digital and analog signals, tracked live and side by side, so a fault is visible the moment it happens.
Replay
Load a recorded session and step through it with dual time cursors to measure how long an event took and how signals relate to each other.
Chain Map
A live map of an industrial Ethernet daisy chain, showing per-node latency and pinpointing exactly where a network segment has failed.
Pinout Library
An offline reference for industrial connector standards: pin numbering, signal assignment, and color coding, without leaving the app.
Why TRACE
Set up in under 2 minutes
No project files and no engineering workstation to configure first. Open it, point it at a PLC, and start reading signals.
One tool, four jobs
Live monitoring, replay, network diagnostics, and a connector reference live in a single application instead of four.
Works without a live PLC
A built-in simulation mode makes it useful for a personal lab or a classroom too, no real PLC hardware required to learn the tool or prepare a layout.
Your data stays yours
TRACE runs locally and doesn't transmit signal data, tags, or project information anywhere.
TRACE is a Windows desktop application that connects to Allen-Bradley controllers over EtherNet/IP. It runs entirely on the local network segment where the PLC lives: no cloud account, no server, no telemetry.